Steps on How to Graph Linear Inequalities
If this is your first time learning how to graph a linear inequality such as [latex]y > x + 1[/latex] , you will realize that after going through this lesson, it boils all down to graphing the boundary line (dashed or solid) and shading the appropriate region (top or bottom).
So where do we start? Below are the suggested steps that you can follow in order to do it right.
Steps on Graphing Linear Inequalities
Step 1: Always start by isolating the variable [latex]\color{red}y[/latex] on the left side of the inequality.
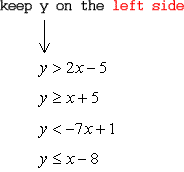
These are the four symbols of inequalities:
- Greater than → [latex] > [/latex]
- Greater than or equal to → [latex] \ge [/latex]
- Less than → [latex] < [/latex]
- Less than or equal to → [latex] \le [/latex]
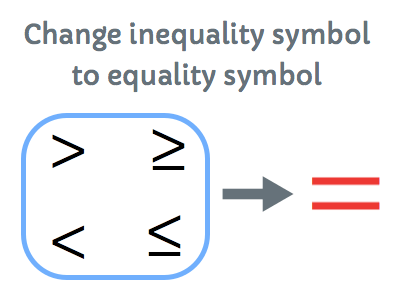
Step 2: Change the inequality to equality symbol. For now, you will deal with a line.
Step 3: Graph the boundary line from step 2 in the [latex]XY-[/latex]plane. The following are the three common methods that you can use to graph a line. It doesn’t matter which one you choose.
- Graphing a Line using Table of Values
- Graphing a Line using [latex]y = mx + b[/latex]
- Graphing a Line using [latex]x[/latex] and [latex]y[/latex]-intercepts
In this step, you are constructing the boundary line that would separate or cut the [latex]XY-[/latex]plane into two regions.
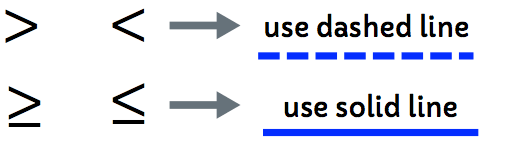
- Use dashed or dotted line if you have the strict inequality symbols which are [latex] > [/latex] and [latex] < [/latex].
- Use solid line if you have non-strict inequality symbols which are [latex] \ge [/latex] and [latex] \le [/latex]. These symbols have the “equal” component to it.
Step 4: The last step is to shade one side or region of the boundary line.
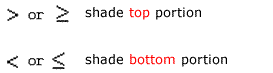
- Shade the top side of the boundary line if you have the inequality symbols [latex]>[/latex] or [latex] \ge [/latex].
- Shade the bottom side of the boundary line if you have the inequality symbols [latex]<[/latex] or [latex] \le [/latex].
Step 5: Use this optional step to check or verify if you have correctly shaded the side of the boundary line.
- Pick a test point located in the shaded area. A point is in the form [latex]\color{blue}\left( {x,y} \right)[/latex].
- Plug the values of [latex]\color{blue}x[/latex] and [latex]\color{blue}y[/latex] taken from the test point into the original inequality, then simplify.
- If the inequality comes out to be a true statement, that means your graph of the inequality is absolutely right! Otherwise, recheck your work because maybe you have shaded the wrong region.
Below is the graph of the inequality [latex]y > x + 1[/latex].
Step 1: The inequality is already in the form that we want. That is, the variable [latex]y[/latex] is isolated on the left side of the inequality.
Step 2: Change inequality to equality. Therefore, [latex]y > x + 1[/latex] becomes [latex]y = x + 1[/latex].
Step 3: Now graph the [latex]y = x + 1[/latex]. Use the method that you prefer when graphing a line. In addition, since the original inequality is strictly greater than symbol, [latex]\Large{\color{red}>}[/latex], we will graph the boundary line as a dotted line.
Step 4: The original inequality is [latex]y > x + 1[/latex]. The greater than symbol implies that we are going to shade the top area or region.
Step 5: To check if we have done it correctly, let’s pick any points on the shaded region. Suppose we pick [latex]\color{blue}\left( { – 3,2} \right)[/latex]. Now, we substitute and evaluate the coordinates of the test point with the original inequality.
[latex]\left( { – 3,2} \right) \Rightarrow x = – 3,\,\,y = 2[/latex]
[latex]y > x + 1[/latex]
[latex]2 > -3 + 1[/latex]
[latex]2 > -2[/latex] ✅
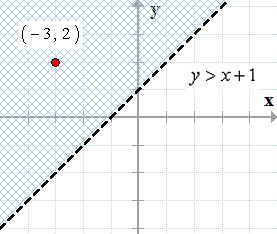
Yes! We have successfully graphed the inequality [latex]\large{\color{green}y>x+1}[/latex].
You might also like these tutorials:
- Solving Linear Inequalities
- Graphing Linear Inequalities Examples
- Graphing Systems of Linear Inequalities
- Solving Compound Inequalities