What is the Slope Formula?
The slope of a straight line describes the line’s angle of steepness from the horizontal whether it rises or falls.
When the line neither rises nor falls, then we claim that it has a slope of zero. This is, in fact, the case of a horizontal line where it extends infinitely to its left or right but without any sign of “rising” or “falling”.
In this lesson, the focus is to go over lots of worked examples to illustrate how to use the formula itself. Remember that two points determine a line. Thus, it is possible to calculate the slope of a straight line, denoted by the symbol, [latex]m[/latex], when we know at least two points where the line passes through.
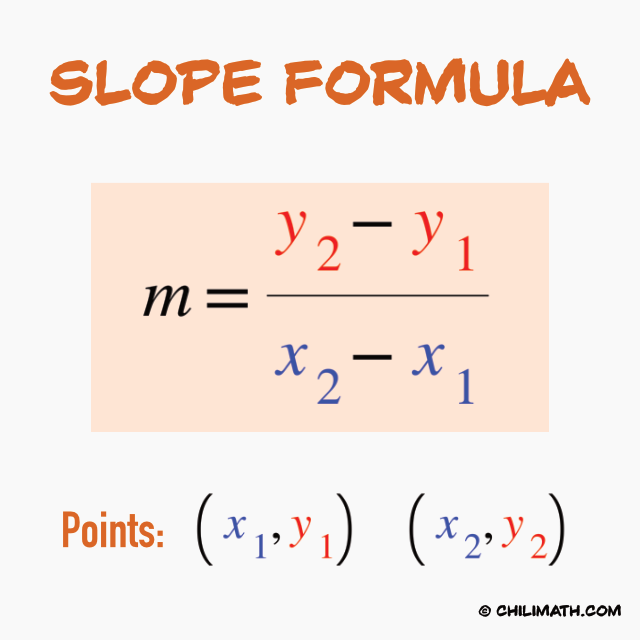
The Slope Formula
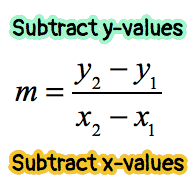
The slope, [latex]m[/latex], of a line passing through two arbitrary points [latex]\left( {{x_1},{y_1}} \right)[/latex] and [latex]\left( {{x_2},{y_2}} \right)[/latex] is calculated as follows.
Few observations:
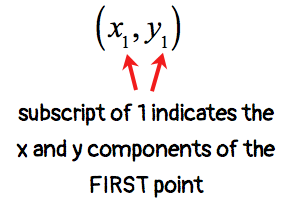
- The coordinates of the first point are assigned with subscript [latex]1[/latex].
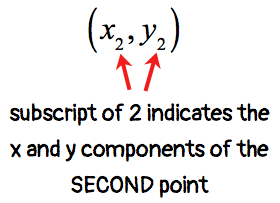
While the coordinates of the second point are assigned with subscript [latex]2[/latex].
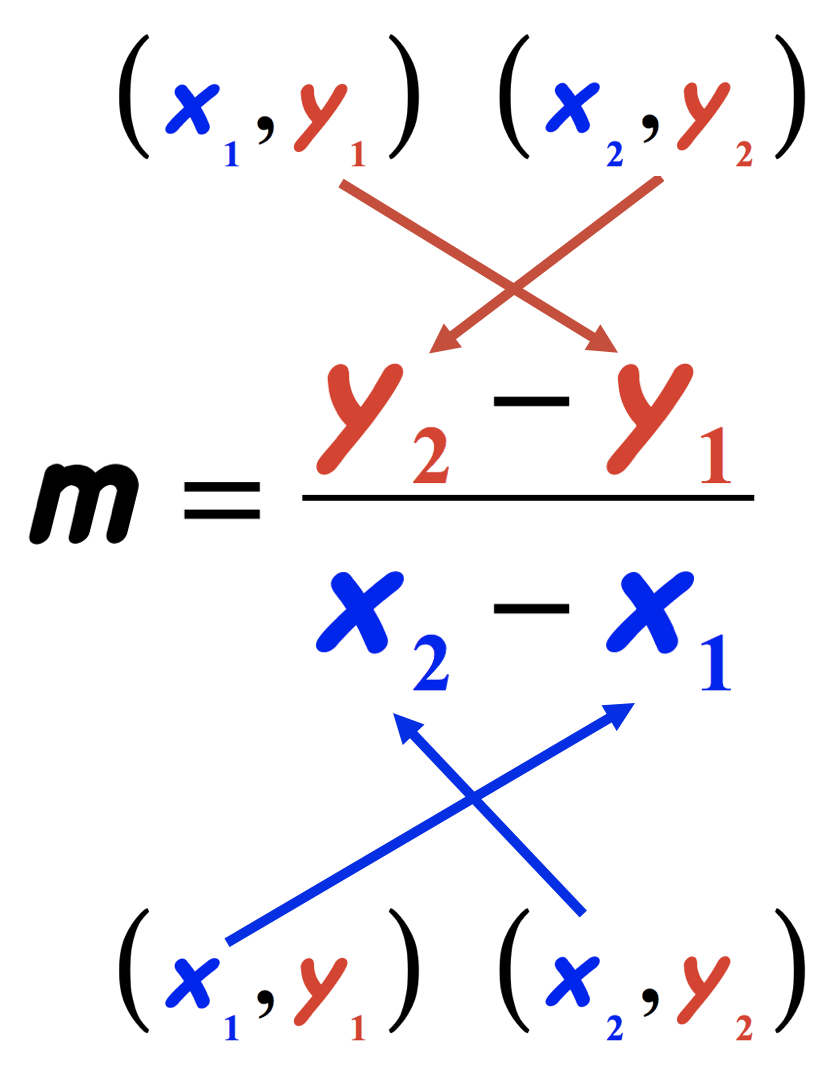
- The numerical value for slope is expressed as a ratio or fraction. The numerator contains the difference of [latex]y[/latex]-values, while the denominator contains the difference of [latex]x[/latex]-values.
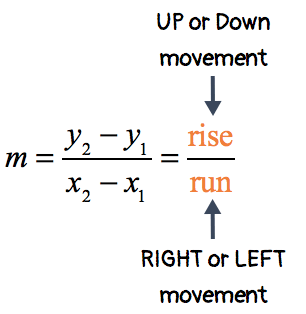
- The slope formula is conceptually defined as the rise over run. The “rise” pertains to the movement of the point along the [latex]y[/latex]-axis, and the “run” pertains to the movement along the [latex]x[/latex]-axis.
Examples of How to Find the Slope of a Line using the Slope Formula
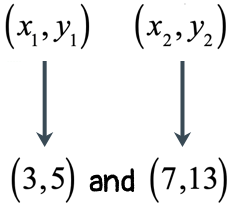
Example 1: Determine the slope of the line passing through the points [latex]\left( {3,5} \right)[/latex] and [latex]\left( {7,13} \right)[/latex].
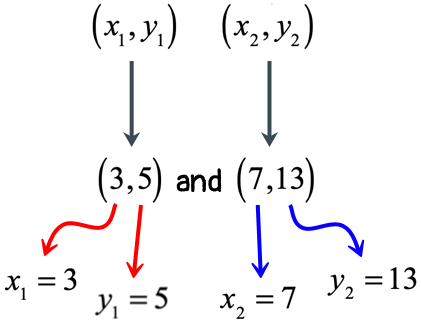
Start by assigning which ones will be our first and second points. If we decide to make [latex]\left( {3,5} \right)[/latex] as the first point, then [latex]\left( {7,13} \right)[/latex] should automatically be the second. The first point uses subscript [latex]1[/latex], and the second point uses subscript [latex]2[/latex]. The diagram below should help us visualize the first step.
Next, it is now easy to extract the values that we will substitute in the slope formula.
We are now ready to substitute the known values into the formula.
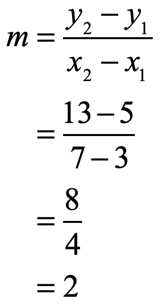
At [latex]m=2[/latex], we have a positive slope and therefore the straight line is rising or increasing from left to right. In other words, having a positive slope is like climbing up a hill. See the graph below.
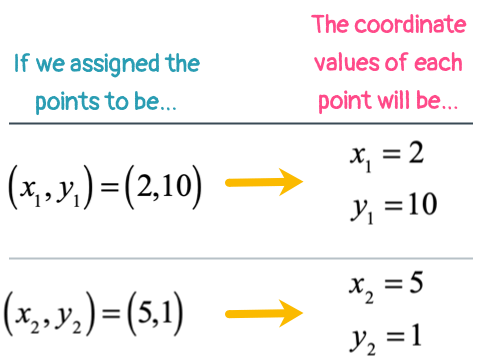
Example 2: Determine the slope of the line passing through the points [latex]\left( {2,10} \right)[/latex] and [latex]\left( {5,1} \right)[/latex].
Identify the first and second points.
Plug these values in the slope formula. Make sure that you subtract the numbers correctly. This is usually where students commit errors because they tend to be careless when doing basic arithmetic operations.
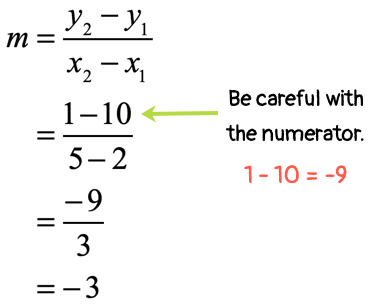
Here is the graph of the line passing through points [latex]\left( {2,10} \right)[/latex] and [latex]\left( {5,1} \right)[/latex] with its corresponding negative slope of [latex]m = – 3[/latex]. This means that the straight line is falling/decreasing from left to right. You may think of it as somebody going down the hill.
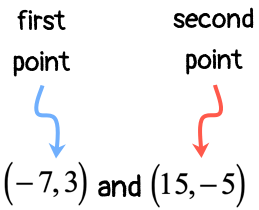
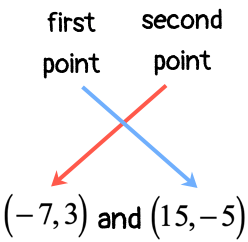
Example 3: Determine the slope of the line passing through the points [latex]\left( { – \,7,3} \right)[/latex] and [latex]\left( {15, – \,5} \right)[/latex].
In this example, I’d like to show you that the numerical value of the slope is ALWAYS the same, regardless of which point you pick to be the “first” or “second”. As long as you maintain the correct order by subtracting the corresponding [latex]y[/latex] and [latex]x[/latex] coordinates, the slope should come out unchanged.
Let me illustrate the idea by solving the slope two ways. See the comparison below.
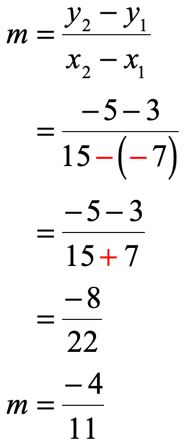
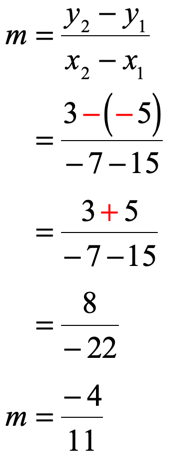
CASE 1 (usual order of points)
- Label each point with appropriate [latex]x[/latex] and [latex]y[/latex] coordinates.
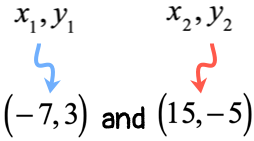
- Evaluate the values into the slope formula
CASE 2 (reverse order of points)
- Label each point with appropriate [latex]x[/latex] and [latex]y[/latex] coordinates.

- Evaluate the values into the slope formula
That’s right! We have shown that the final answers for slope came out to be the same although we switched the order of points.
Just a quick reminder, be very careful when you are subtracting negative numbers. Remember that subtraction by a negative number is the same as adding the negative value of that number. We can think of it as [latex]x – a = x + \left( { – a} \right)[/latex].
You may have heard before that “two negative signs” becomes positive. That is the reason why when I was subtracting by a negative number, I intentionally placed that negative number inside
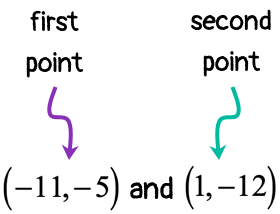
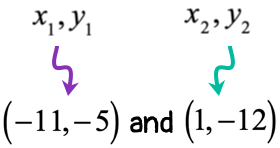
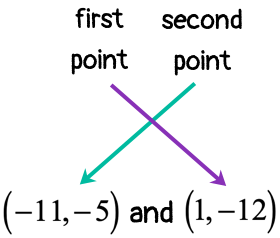
Example 4: Find the slope of the line that goes through the points [latex]\left( { – \,11, – \,5} \right)[/latex] and [latex]\left( {1, – \,12} \right)[/latex].
Solve this again side by side in two ways, to nail down the concept that reversing the order of points doesn’t affect the final outcome of the slope.
CASE 1 (usual order of points)
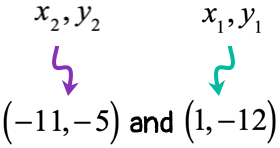
- Label each point with appropriate [latex]x[/latex] and [latex]y[/latex] coordinates.
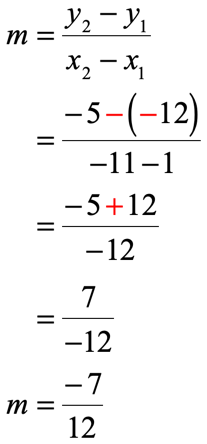
- Evaluate the values into the slope formula
![m=(y sub 2 minus y sub 1) divided by (x sub 2 minus x sub 1) = [(-12-(-5)]/[1-(-5)] = (-12+5)/(1+11) = -7/12](https://www.chilimath.com/wp-content/uploads/2019/02/sf-ex4c.png)
CASE 2 (reverse order of points)
- Label each point with appropriate [latex]x[/latex] and [latex]y[/latex] coordinates.
- Evaluate the values into the slope formula
This is wonderful! We arrived at the same final answer using two different routes of calculation.
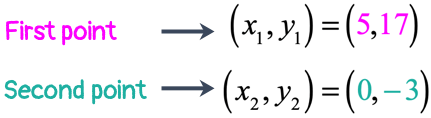
Example 5: Find the slope of the line that goes through the points [latex]\left( {5,17} \right)[/latex] and [latex]\left( {0, – \,3} \right)[/latex].
If you want to solve this step by step, you may do it this way.
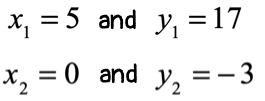
- Step 1: Label the points
- Step 2: Extract values
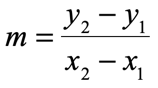
- Step 3: Write the slope formula
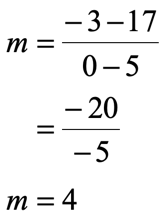
- Step 4: Substitute values from Step 2, then simplify.
Notes:
- For the numerator: adding two negative numbers yields a negative answer. Since,
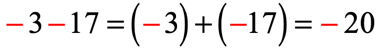
- Also, dividing two negative numbers results to a positive answer. That’s why our final answer for slope is [latex]m = + \,4[/latex].
Example 6: Find the slope of the line that goes through the points [latex]\left( { – \,1, – \,2} \right)[/latex] and [latex]\left( { – \,3, – \,4} \right)[/latex].
This looks like a fun problem because all the entries of the two points are negative numbers. I bet you that your teacher may throw something like this in order to test if you are careful dealing with the subtraction of negative numbers.
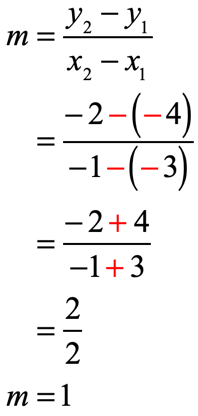
Let the first point be [latex]\left( { – \,3, – \,4} \right)[/latex] and [latex]\left( { – \,1, – \,2} \right)[/latex] be the second. Labeling their corresponding coordinate values, and substituting we should get
- First point
- Second point
- Evaluate values into the slope formula
Example 7: Solve the slope of the line passing through the points [latex]\left( {6, – \,8} \right)[/latex] and [latex]\left( {14, – \,8} \right)[/latex].
This problem is an example of a horizontal line. It happens when the computed value of the slope equals zero!
Suppose
and
The computation of the slope of the line is shown below.
![m=[-8-(-8)]/(14-6) = (-8+8)/(14-6) = 0/8 = 0, thus the slope is equal to zero, or m=0](https://www.chilimath.com/wp-content/uploads/2019/03/sf-ex7c.png)
Indeed, the line is horizontal as shown in the graph. The line behaves this way because no matter how the [latex]x[/latex]-coordinates vary, the [latex]y[/latex]-values are constant or not changing. The effect is that as long as the [latex]y[/latex] doesn’t change, the plotted points will all remain in that same horizontal line where [latex]y = – 8[/latex].
Example 8: Solve the slope of the line passing through the points [latex]\left( {10,0} \right)[/latex] and [latex]\left( {10,9} \right)[/latex].
This last example illustrates when the line passing through two given points is a vertical line.
All vertical lines have no slope because the numerical value of their slopes results in the division by zero, commonly known as undefined.
Let [latex]\left( {{x_1},{y_1}} \right) = \left( {10,0} \right)[/latex] and [latex]\left( {{x_2},{y_2}} \right) = \left( {10,9} \right)[/latex].
The slope of the straight line is calculated as follows.
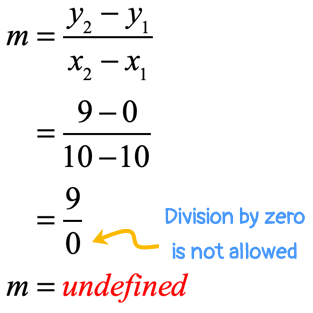
Any nonzero number divided by zero has no answer. That’s why we just call it undefined. Here’s the graph to show the vertical line.
You might also like these tutorials: