Three Ways How to Graph a Line
Graphing a line in the xy-axis is one of the most basic skills in algebra that you should learn. In this lesson, we are going to go over three methods that are commonly used. Learn each method and you’ll be able to decide which one works better depending on the given problem.
I have created separate lessons for each. Click the link at the bottom of each method.
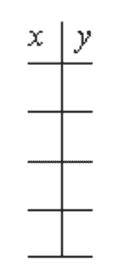
Method 1: Constructing a Table of Values
This is the most straightforward method of graphing a line. What we need to do is to select some values of x and then evaluate those values in the given equation to get the corresponding values of y. Finally, plot those points in the XY-axis, and connect them with a straight edge.
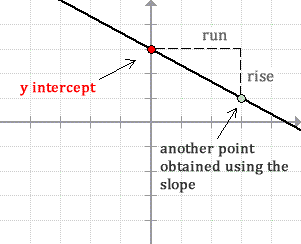
Method 2: Using the Slope and y-intercept (y = mx+b)
The first step is to make sure that the equation of the line is in the Slope-Intercept Form, that is [latex]y=mx+b[/latex].
- Start by plotting the y-intercept which is [latex](0,b)[/latex].
- Find another point using the slope [latex]m[/latex] with the y-intercept at the reference point.
- Connect the two points with a ruler.
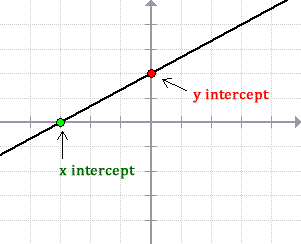
Method 3: Connecting the x and y-Intercepts
Remember, we only need two points to graph a line. With that idea, we take advantage of the two “convenient” points which can easily be solved algebraically from the equation of the line; namely, the x-intercept [latex](x,0)[/latex] and y-intercept [latex](0,y)[/latex].
- To solve for the x-intercept, let [latex]y=0[/latex] then solve for [latex]x[/latex].
- To solve for the y-intercept, let [latex]x=0[/latex] then solve for [latex]y[/latex].
- Connect the two points using a ruler.
You might also like these tutorials:
- Graphing a Line using Slope and y-intercept
- Graphing a Line using Table of Values
- Graphing a Line Using X and Y intercepts