Finding the Domain and Range of Linear and Quadratic Functions
Let’s start this lesson by having an overview of the meanings of the math terms domain and range before going into some examples on how to find them both algebraically and graphically.
Before we proceed, I also would like to let you know that I have a separate lesson on how to find the domain and range of radical and rational functions.
DOMAIN OF A FUNCTION
The domain of a function is the set of all allowable values of the independent variable, commonly known as the [latex]x[/latex]-values. To find the domain, I need to identify particular values of [latex]x[/latex] that can cause the function to “misbehave” and exclude them as valid inputs to the function.
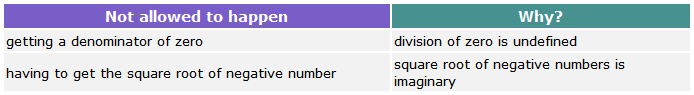
The values of [latex]x[/latex] that can result in the following conditions are not included in the domain of the function.
Now, how about the range of a function?
RANGE OF A FUNCTION
The range of a function is the set of output values when all [latex]x[/latex]-values in the domain are evaluated into the function, commonly known as the [latex]y[/latex]-values. This means I need to find the domain first in order to describe the range.
To find the range is a bit trickier than finding the domain. I highly recommend that you use a graphing calculator to have an accurate picture of the function. However, if you don’t have one, I encourage you to sketch some of the basic functions by hand. Either way, it is crucial that you have a good idea of what the graph looks like in order to correctly describe the range of the function.
Examples of Finding the Domain and Range of Linear Functions and Quadratic Functions
Example 1: Find the domain and range of the linear function
[latex]y = 3x – 1[/latex]
The first thing I’ve observed is that there is no square root symbol or denominator in this problem. This is wonderful because getting a square root of a negative number or a division of zero is not possible with this function. Since there are no [latex]x[/latex]-values that can make the function to output invalid results, I can easily claim that the domain is all x values. However, it is much better to write it in set notation or interval notation.
Here’s the summary of the domain and range of the given function written in two ways…
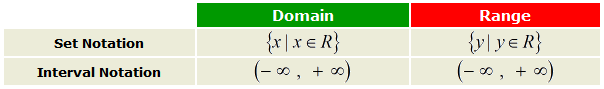
Because the function involved is a line, I can predict that the range is all y values. It can definitely go as high or as low without any limits. Look at the graph below to understand what I mean.
It’s always wonderful to see the graph of the function together with its domain and range, in pictorial format.
Example 2: Find the domain and range of the quadratic function
[latex]y = {x^2} + 3[/latex]
I can see that I can plug any values of [latex]x[/latex] into the function and it will produce a valid output. So, I can safely say that its domain is all x values. This time, however, I need to be careful how to describe the range. Is it going to be all [latex]y[/latex] values? Well, I don’t think so, because I know this function is a parabola and one of its traits is having a high point (maximum) or a low point (minimum). To be safe, I will first graph it.
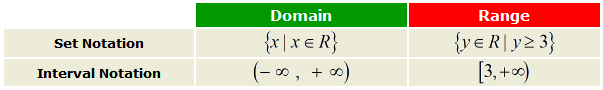
The graph of the parabola has a low point at [latex]y = 3[/latex] and it can go as high as it wants. Using inequality, I will write the range as y ≥ 3.
Summary of domain and range in tabular form:
Example 3: Find the domain and range of the quadratic function
[latex]y = – {x^2} + 2[/latex]
I hope that the previous example has given you an idea of how to work this out. This is a quadratic function, thus, the graph will be parabolic. I know that this will also have either a minimum or a maximum. Since the coefficient of the [latex]x^2[/latex] term is negative, the parabola opens downward and therefore has a maximum (high point). The domain should be all [latex]x[/latex] values because there are no values that when substituted into the function will yield “bad results”.
Although the range is easy to find, I’d rather “play safe” and graph it again.
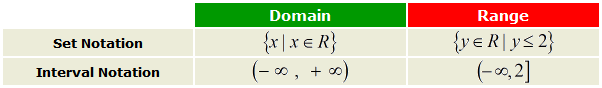
The parabola has a maximum value at [latex]y = 2[/latex] and it can go down as low as it wants. The range is simply y ≤ 2.
The summary of domain and range is the following:
Example 4: Find the domain and range of the quadratic function
[latex]y = {x^2} + 4x – 1[/latex]
Just like our previous examples, a quadratic function will always have a domain of all x values.
I want to go over this particular example because the minimum or maximum is not quite obvious. Notice though that the parabola is in the Standard Form, [latex]y = a{x^2} + bx + c[/latex].
I want to transform this into the Vertex Form, [latex]y = a{\left( {x – h} \right)^2} + k[/latex], where the vertex is [latex]\left( {h,k} \right)[/latex] using the method of Completing the Squares.
The parabola opens upward and the vertex must be a minimum. The coordinate of the vertex is…
I can now see that this parabola has a minimum value at [latex]y = −5[/latex], and can go up to positive infinity.
The range should be y ≥ −5.
To verify it using its graph, I have this diagram.
You might also like these tutorials: