Plotting Points on a Graph
In this tutorial, I have prepared eight (8) worked-out examples on how to plot a point in a Cartesian plane (named in honor of French mathematician Renè Descartes). To plot a point, we need to have two things: a point and a coordinate plane.
Let’s briefly talk about each one.
A Point
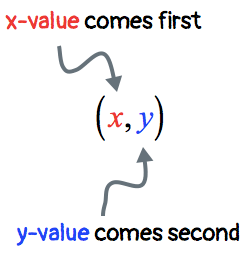
A point in a plane contains two components where order matters! It comes in the form ([latex]x[/latex],[latex]y[/latex]) where [latex]x[/latex] comes first, and [latex]y[/latex] comes second.
- The [latex]x[/latex]-value tells how the point moves either to the right or left along the [latex]x[/latex]-axis. This axis is the main horizontal line of the rectangular axis or Cartesian plane.
- The [latex]y[/latex]-value tells how the point moves either up or down along the [latex]y[/latex]-axis. This axis is the main vertical line of the rectangular axis or Cartesian plane.
COORDINATE PLANE (Cartesian Plane)
A coordinate plane is composed of two lines intersecting at a 90-degree-angle (making them perpendicular lines) at the point (0,0) known as the origin.
- The [latex]x[/latex]-component of the point ([latex]x[/latex],[latex]y[/latex]) moves the point along a horizontal line. If the [latex]x[/latex]-value is positive, the point moves “[latex]x[/latex]-units” towards the right side. On the other hand, if the [latex]x[/latex]-value is negative, the point moves “[latex]x[/latex]-units” towards the left.
- The [latex]y[/latex]-component of the point ([latex]x[/latex],[latex]y[/latex]) moves the point along a vertical line. If the [latex]y[/latex]-value is positive, the point moves “[latex]y[/latex]-units” in an upward direction. However, if the [latex]y[/latex]-value is negative, the point moves “[latex]y[/latex]-units” in a downward direction.
Quadrants of a Cartesian Plane
The intersection of the [latex]x[/latex]-axis and [latex]y[/latex]-axis results in the creation of four (4) sections or divisions of the Cartesian plane.
- The first quadrant is located at the top right section of the plane.
- The second quadrant is located at the top left section of the plane.
- The third quadrant is located at the bottom left section of the plane.
- The fourth quadrant is located at the bottom right section of the plane.
Examples of How to Plot Points on a Graph and Identify its Quadrant
Example 1: Plot the point (4,2) and identify which quadrant or axis it is located.
I will start by placing a dot at the origin which is the intersection of [latex]x[/latex] and [latex]y[/latex] axes. Think of the origin as the “home” where all points come from.
Next, I will move the dot from the origin 4 units to the right since [latex]x[/latex] = 4 (positive in [latex]x[/latex]-axis means right side movement). Remember, [latex]x[/latex]-value is the first number in the ordered pair (4,2).
From where I left off, I need to move two units going up, parallel to the main vertical axis since [latex]y[/latex] = 2 (positive in [latex]y[/latex]-axis means an upward movement). The [latex]y[/latex]-value is the second number in the ordered pair (4,2).
The final answer should look like this…
The point (4,2) is located in Quadrant I.
Example 2: Plot the point (–5, 4) and identify which quadrant or axis it is located.
Start by placing a dot at the origin which is known as the center of the Cartesian coordinate axis.
From the origin, since [latex]x[/latex] = −5, move 5 units going left.
…followed by moving the point 4 units up because [latex]y[/latex] = 4.
This is the final answer. Since the plotted point is in the top left section of the [latex]xy[/latex]-axis, then it must be in Quadrant II.
Example 3: Plot the point (5, –3) and identify which quadrant or axis it is located.
Start from the center of the Cartesian plane.
Move 5 units to the right since [latex]x[/latex] = 5.
Followed by moving 3 units down since [latex]y[/latex] = −3.
The final plotted point is shown below. Being in the bottom right section of the Cartesian plane means that it is in Quadrant IV.
Example 4: Plot the point (–2, –5) and identify which quadrant or axis it is located.
Place a dot at the origin (center of the [latex]xy[/latex]-axis). Since [latex]x[/latex] = −2, move the point 2 units to the left along the [latex]x[/latex]-axis. Finally, go down 5 units parallel to the [latex]y[/latex]-axis because [latex]y[/latex] = −5.
See the animated solution below.
The plotted point is located at the bottom left section of the Cartesian plane. Thus, it is in Quadrant III.
Example 5: Plot the point (0,3) and identify which quadrant or axis it is located.
I start by analyzing the given ordered pair. Since [latex]x[/latex] = 0, this means that there is no movement in the [latex]x[/latex]-axis. However, [latex]y[/latex] = 3 implies that I need to move it 3 units in the upward direction.
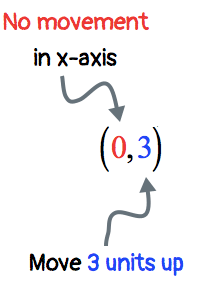
The plotted point is neither in Quadrant I nor in Quadrant II. To describe its location, we say that it is found along the positive [latex]y[/latex]-axis.
Example 6: Plot the point (0, –4) and identify which quadrant or axis it is located.
This is very similar to example 5. There will be no movement along the [latex]x[/latex]-axis since [latex]x[/latex] = 0. On the other hand, [latex]y[/latex] = − 4 tells me that I need to move the point from the origin 4 units down.
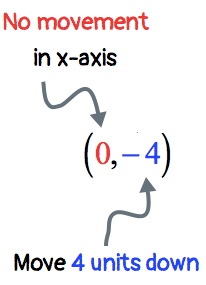
The final point is located neither in Quadrant III nor Quadrant IV. I can claim that it is found along the negative [latex]y[/latex]-axis.
Example 7: Plot the point (–3,0) and identify which quadrant or axis it is located.
From the origin, I will move it 3 units to the left along the [latex]x[/latex]-axis since [latex]x[/latex] = −3. For [latex]y[/latex] = 0, it means no y-movement will follow.
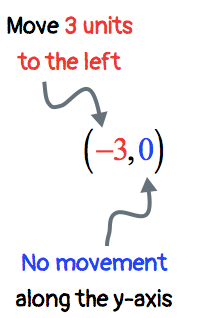
The point is located neither in Quadrant II nor Quadrant III. It is found along the negative [latex]x[/latex]-axis.
Example 8: Plot the point (2,0) and identify which quadrant or axis it is located.
With [latex]x[/latex] = 2, I need to move it 2 units to the right. Having [latex]y[/latex] = 0 implies that no y-movement will occur.
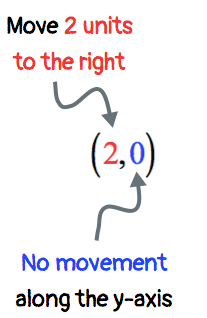
The plotted point is located neither in Quadrant I nor Quadrant IV. It is found along with the positive [latex]x[/latex]-axis.
Take a quiz: