
Finding the Mean, Median, Mode and Range
The three distinct calculations associated with the Measure of Central Tendency are the Mean, Median, and Mode. Each measurement is an attempt to capture the essence of how a typical entry or number in the data set may look like. The idea is to compute a single value that can represent the entire elements of the set.
In this lesson, I have prepared eight (8) worked examples to illustrate how to perform the required computations.
Measures of Central Tendency
Let’s first go over the main ideas of each measure of the central tendency.
MEAN
Description:
“Average” value of the set of numbers
How to find…
Add all numbers to get a total, then divide by the number of entries (number count of values you added).
Advantages:
- Takes into account every number in the data set. That means all numbers are included in calculating the mean.
- Easy and quick way to represent the entire data values by a single or unique number due to its straightforward method of calculation.
- Each set has a unique mean value.
Disadvantages:
Its value is easily affected by extreme values known as the outliers.
MEDIAN
Description:
Middle value of the set of numbers
How to find…
- Organize the numbers in increasing order, the median is the middle or centermost number.
- If there are two middle numbers, add them and divide by 2 to get the median.
Advantages:
- Not affected by the outliers in the data set. An outlier is a data point that is radically “distant” or “away” from common trends of values in a given set. It does not represent a typical number in the set.
- The concept of the median is intuitive and thus can easily be explained as the center value.
- Each set has a unique median value.
Disadvantages:
Its value is perceived as it is. It cannot be utilized for further algebraic treatment.
MODE
Description:
Most common or frequent value or item of the set
How to find…
Tally or count how many times a number appears in the list of data. The mode is the one that shows the most.
Advantages:
- Just like the median, the mode is not affected by outliers.
- Useful to find the most “popular” or common item. This includes data sets that do not involve numbers.
Disadvantages:
If the set contains no repeating values, the mode is irrelevant. In contrast, if there are many values that have the same count, then mode can be meaningless. I did not include the range in the tabs above because it is not really a measure of central tendency. However, the concept of range is usually discussed alongside Mean, Median, and Mode. So, what is it then?
RANGE
Range (in statistics) is the difference between the maximum and minimum values of the set. What the range provides is a quick and rough estimate of the spread of data values within a set.
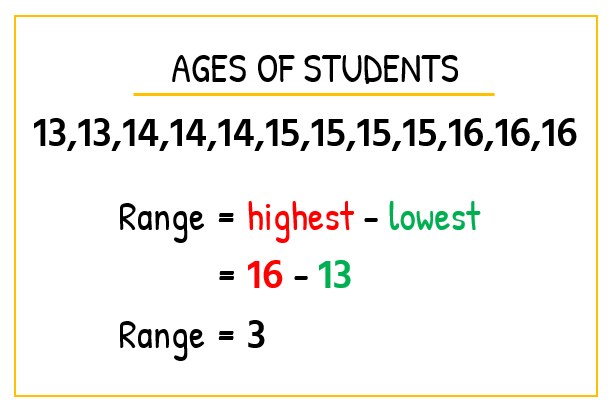
Consider the two scenarios below. Here we have two classes taking Algebra 1 and the ages of the students in each class.
- Algebra Class A
- Algebra Class B
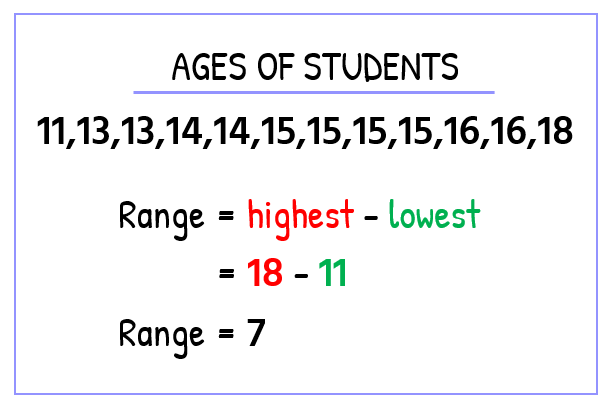
Observations:
- Since the range of Class A is smaller than in Class B, can we claim that the age distribution in Class A is more clustered (closely related) than in Class B? In other words, are the ages listed in Class A more uniform than in Class B?
Not so fast! This is, in fact, the biggest limitation of using the range to describe the spread of data within a set. The reason is that it can drastically be affected by outliers (values that are not typical as compared to the rest of the elements in the set).
- Notice that when we disregard the outliers in Class B (ages 11 and 18), the “new” range becomes…
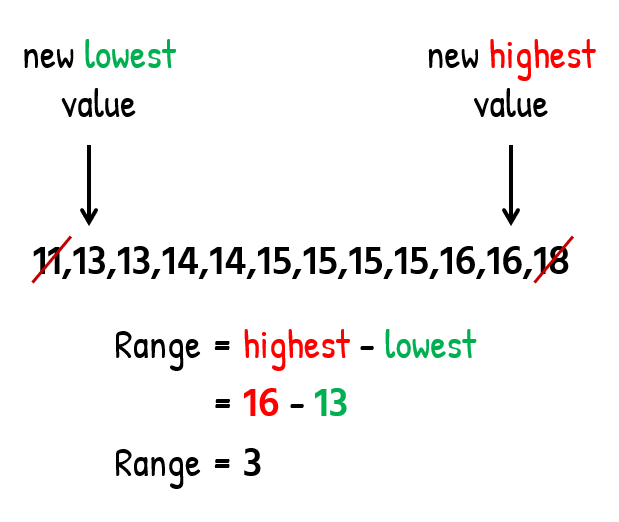
…which is now equal to the range of Class A. So the “big take” from this example is to be very careful when interpreting the values of the range, especially when comparing two sets.
Examples of How to Find the Mean, Median, Mode, and Range
Example 1: Find the mean, median, mode, and range for the following list of values
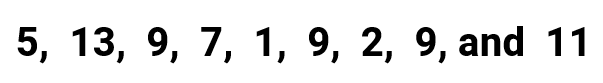
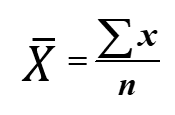
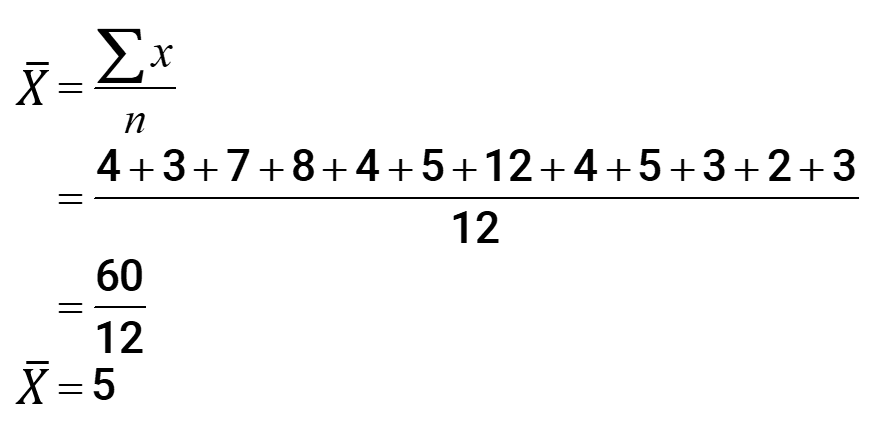
The mean is commonly known as the “average” which is calculated by getting the sum of all values in the list and then divided by the number of entries. The symbol used to represent the mean is [latex]\bar X[/latex], often read as “x-bar”.
- To find the mean:
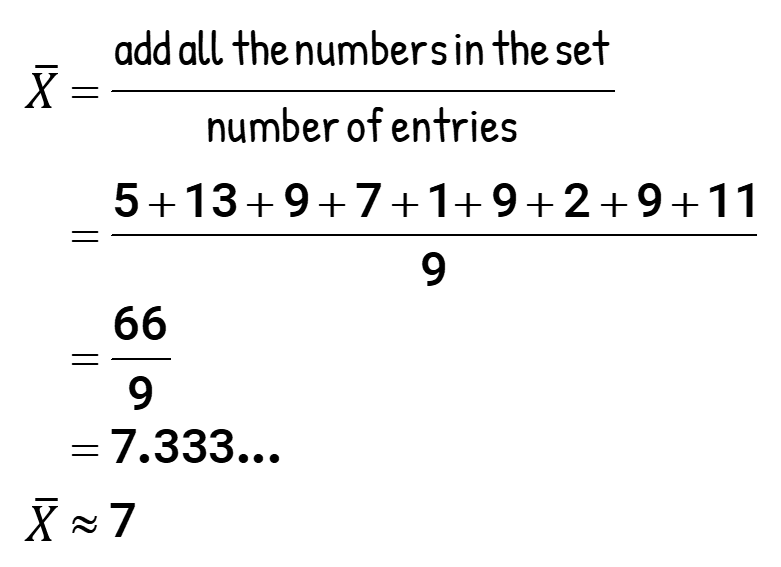
I rounded off the final answer to the nearest whole number because all the numbers in the set are also whole numbers. To be more specific, I rounded off the mean to the nearest “ones” place or digit.
Rounding off is an approximation so I use the wavy equal symbol [latex]\left( \approx \right)[/latex] to suggest that it is an estimate and not an exact answer. However, be proactive by asking your teacher how many decimal places to round off your final answer.
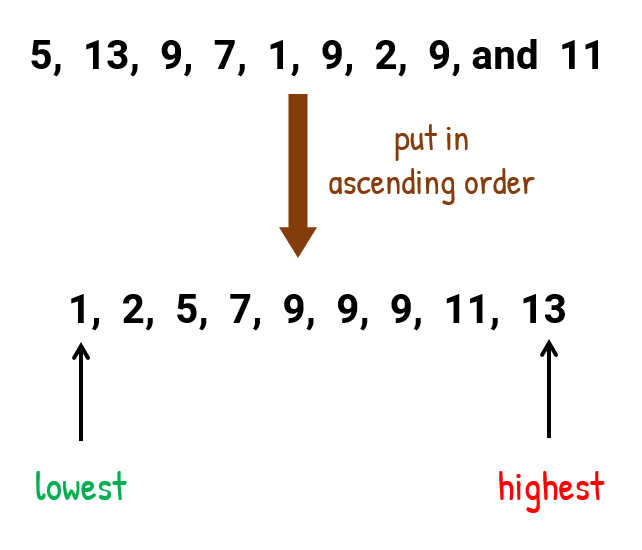
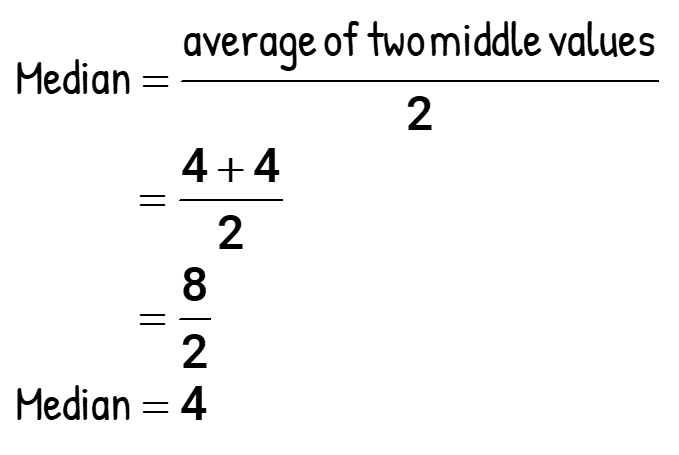
- To find the median:
I must organize the numbers from lowest to highest, and identify the “middle” value.
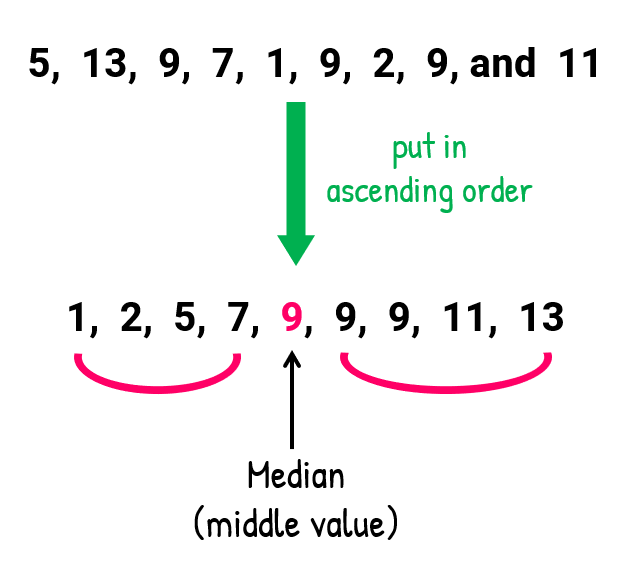
In addition, since the number count of entries is odd, it is guaranteed to have a middle value. A quick shortcut to determine which entry is the median is to add the number of entries (call it [latex]x[/latex]) by 1 then divide by 2. Use the output value here to count from either the left or right of the ordered list to pinpoint the exact location of the median.
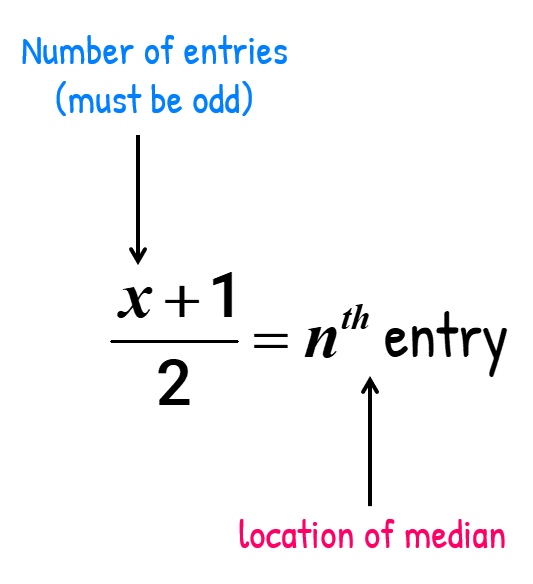
From our previous problem, the number of count of elements in the set is [latex]x = 9[/latex] so we have
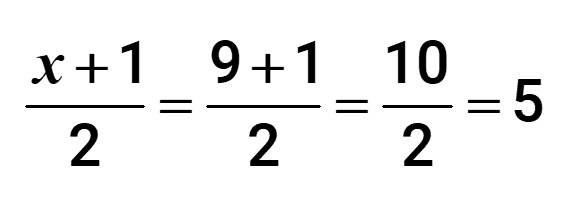
Therefore, the median is located by finding the 5th entry when counted from either the left or right of the ordered list.
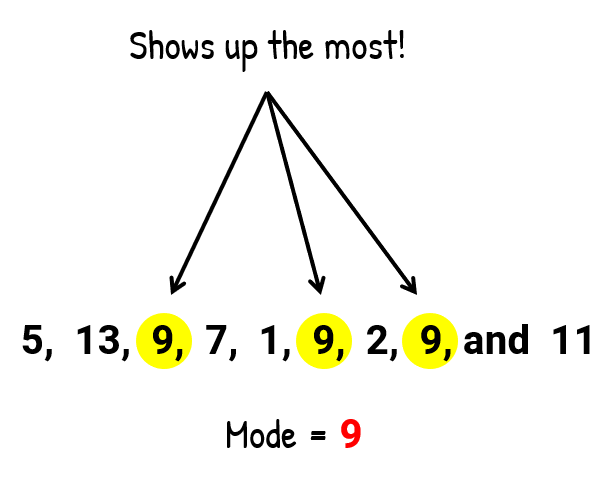
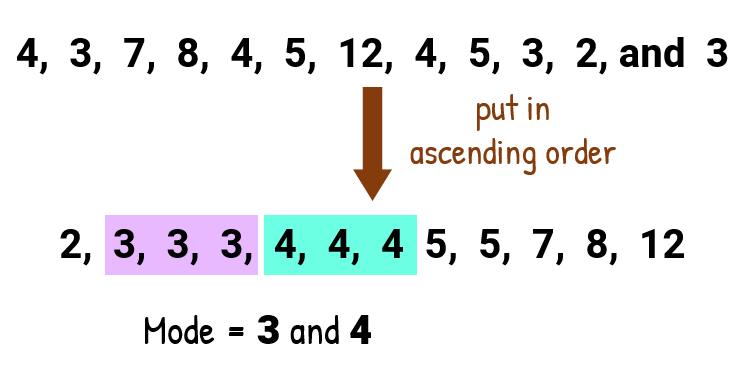
- To find the mode:
The mode is the number in the list that appears the most, which in this case, the number 9. This number is repeated three times.
- To find the range:
We don’t need to organize the list into numerical order to find the lowest and highest values. You should be able to pick those required two values by quick inspection.
Since the range is the difference between the highest and lowest value, thus, range = highest − lowest = 13 − 1 = 12.
Example 2: Find the mean, median, mode, and range for the following list of values
- To find the mean:
Another way to solve for the mean is to use the formula
where the numerator is read as “the summation of all [latex]x[/latex] values”, and the denominator [latex]n[/latex] is just the number count of values in a set.
- To find the median:
If we list the values in numerical order, the median is found at the “centermost” location. But here we have no single value at the center of the list. To address this issue, we are going to solve for the median by finding the average or mean of the two middle values.
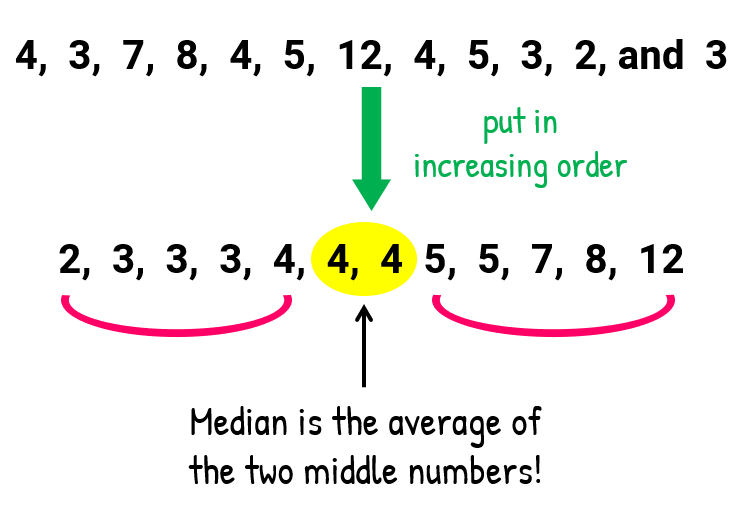
It just happens that the two center values are the same, therefore the average of two equal numbers will equal the same number.
- To find the mode:
By quick inspection, we should observe that two numbers (3 and 4) appear most frequently on the list. Can we say that we have a tie because they both repeat three times on the list? That precisely is the case. We have a situation here where two modes exist! Some textbooks would call this set bimodal, which means having two modes.
- To find the range:
Range is equal to maximum value minus minimum value which gives us: 12 − 2 = 10.
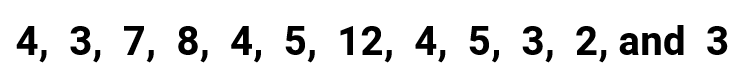
Example 3: Find the mean, median, mode and range for the following list of values
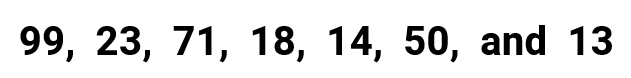
To determine the value of the mean, obtain the total of all the numbers and then divide by the number of numbers in the list. Since all given values are whole numbers, then it makes sense to have the final answer also expressed as a whole. Therefore, I will round it off to the nearest ones’ place.
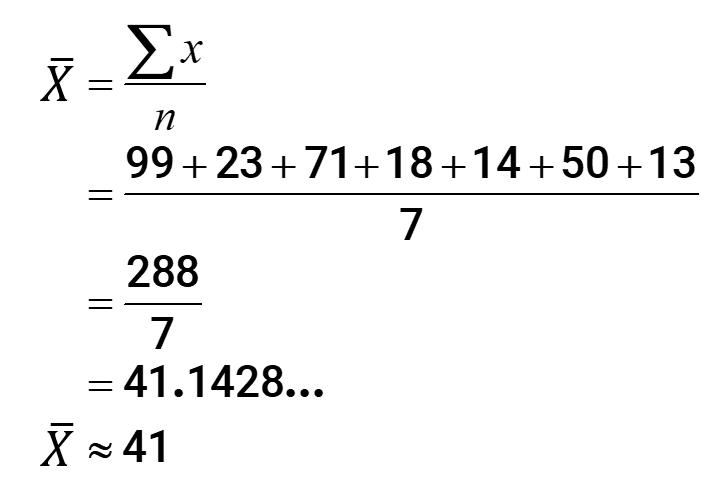
To solve for the median, let’s arrange the list in increasing order and then pick the center value. Obviously, the median here equals 23.
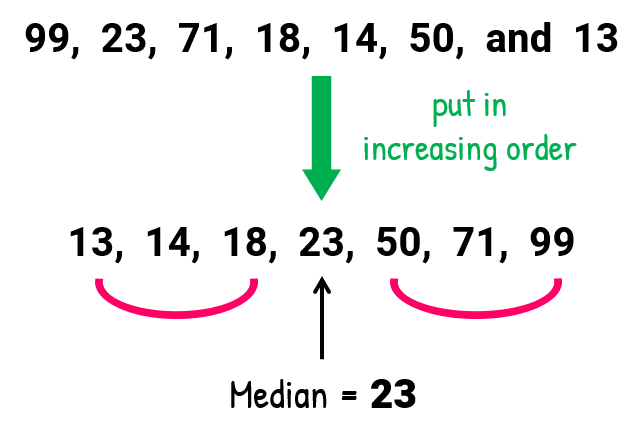
To solve for the mode, identify the most “popular” value or entry in the list. Is there an element that appears more often in the list?
It is apparent that no value is repeated more often than the other. In fact, each unique number only shows up one time. So, this set has no mode.
The range is the easiest to find, Range = highest value minus lowest value. This gives us RANGE = 99 − 13 = 86.
Example 4: Find the mean, median, mode, and range for the following list of values
This is an interesting example because the elements in the set now contain zeroes, a positive, and negative numbers. However, the methods that are used to solve for the mean, median, mode, and range do not change.
- So for the mean, I will solve it as usual by finding its “average”. Since we are dealing with negative numbers, it is a good practice to place them inside the parenthesis to caution us to be careful in combining them. Round off your answer to the nearest ones’ place.
![average = [(-5)+(-9)+(-35)+0+3+(-17)+(-5)+0]/8 = -68/8 = -8.5](https://www.chilimath.com/wp-content/uploads/2019/06/mean-or-average-of-eight-negative-numbers.png)
- For the median, we need to be careful in rearranging the numbers in increasing order because of the negative numbers. Remember that zero is always greater than any negative numbers. More so, to compare which of the two negative numbers is greater than the other, we need to compare both using their absolute values. The negative number with the smaller absolute value is the larger number!
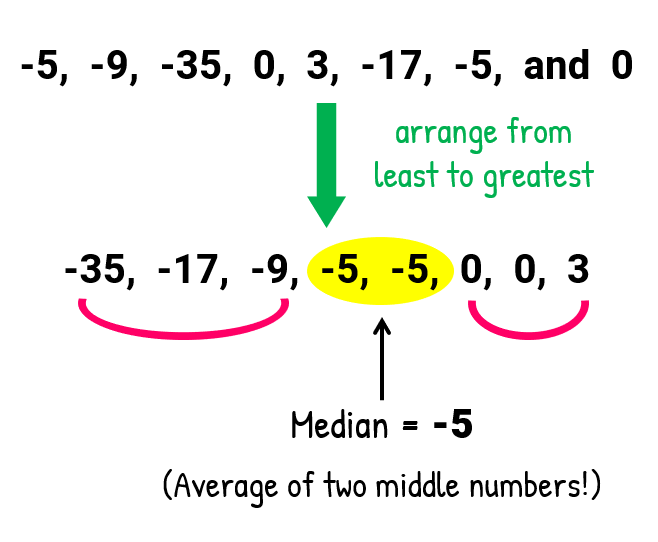
It just happens that the two middle numbers are equal. Thus, their average will simply be the number itself.
- For the mode, find the elements of the set that appears more often. It looks like we also have a tie! Both − 5 and 0 repeat themselves twice. The modes
then are − 5 and 0.
- The range is computed as follows:
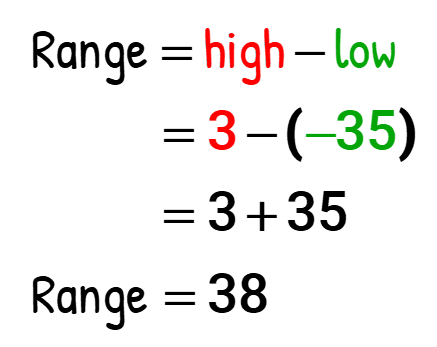
Remember that two negative signs turn out to be positive. Make sure that you always remember this simple rule to prevent any unnecessary algebraic mistakes.
Example 5: Find the mean, median, mode, and range for the following list of values

This example contains a set wherein all numbers have two decimal places. The rule of thumb is to ensure that any results of our computations must also be rounded off to the same decimal places. Again, it wouldn’t hurt if you ask advice from your teacher on how many decimals to round off as this part of the solution may be open to different interpretations.
- Finding the mean:
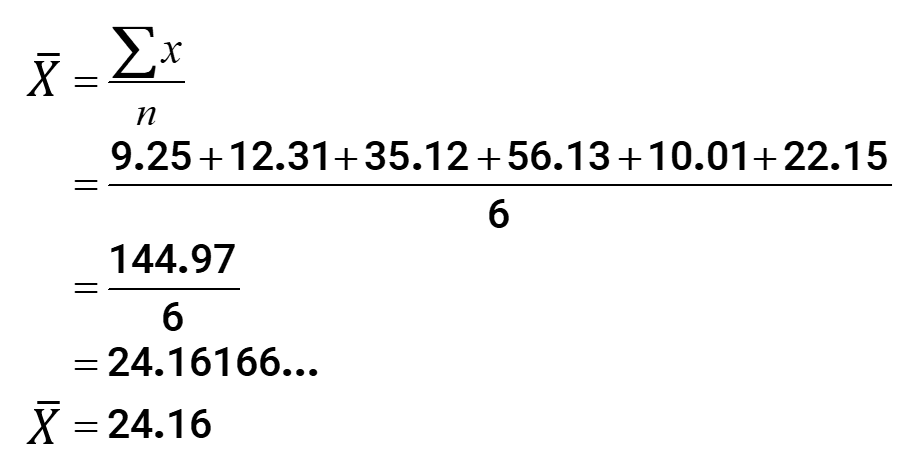
As you can see, I rounded off the final value of the mean to two decimal places.
- Finding the median:
Arrange the numbers in increasing order – that is, from least to greatest. By having an even number of entries in the set suggests that we will have two middle numbers. This is always the case! You should anticipate getting the average of the two middle values to obtain the answer for the median.
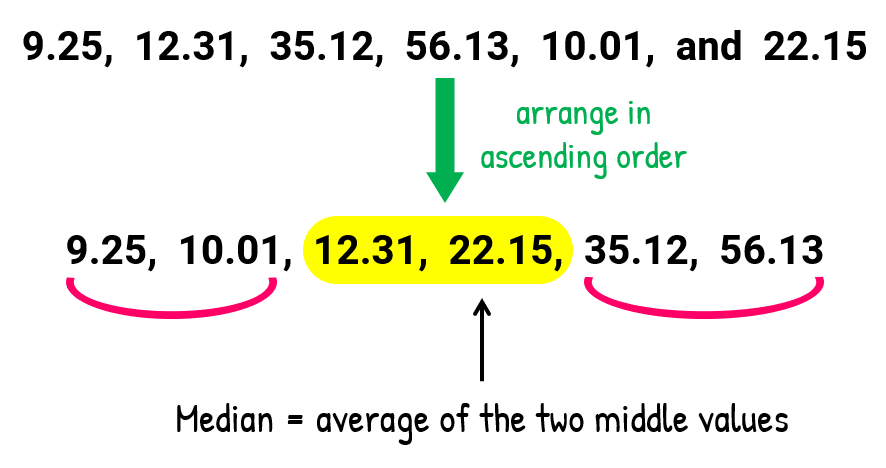
Here is the computation of the median…
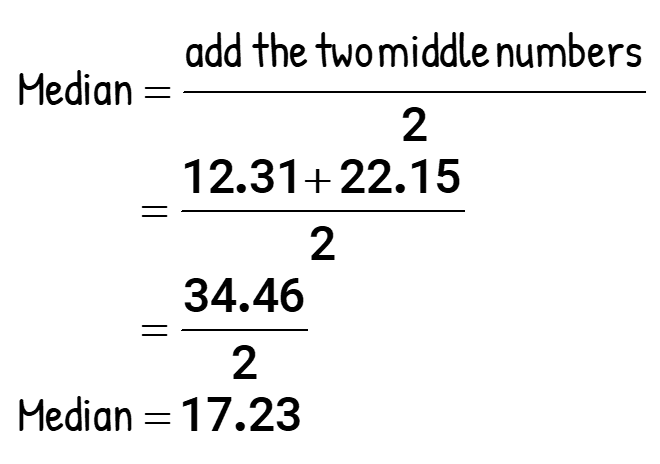
After dividing the sum of two middle numbers by 2 yields an answer with two decimal places. This is perfect! No need to do some rounding off.
- Finding the mode:
Since each element in the set appears just once (no repeating values), we say that this set has no mode.
- Finding the range:
The highest value is 56.13, while the lowest value is 9.25. The range is just the difference between them.
Range = 56.13 − 9.25 = 46.88
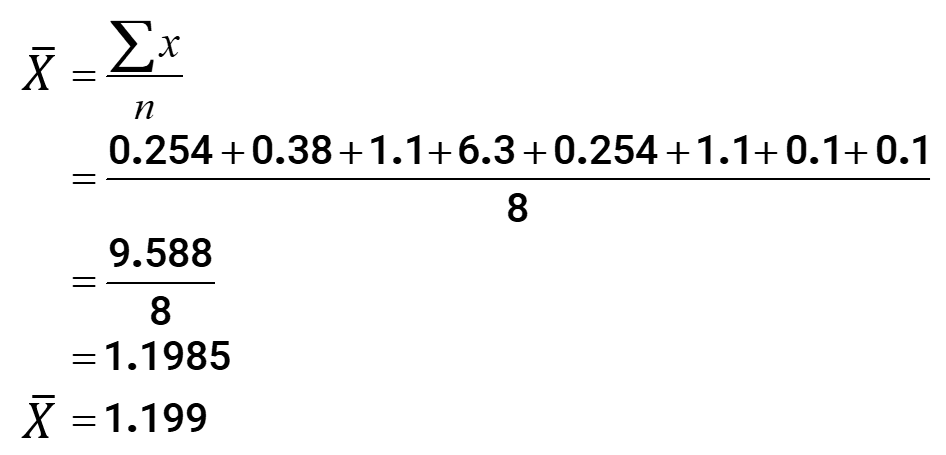
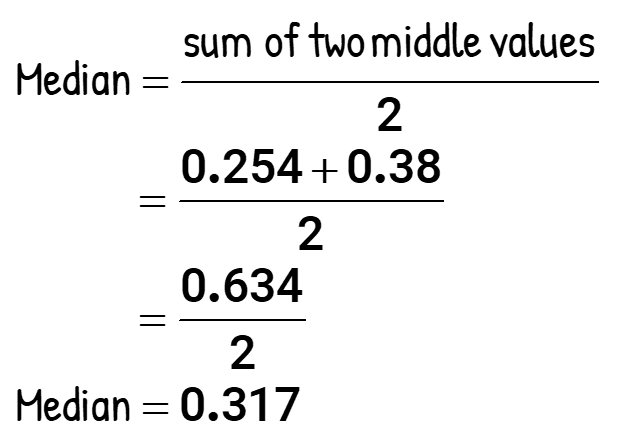
Example 6: Find the mean, median, mode, and range for the following list of values

By quick inspection, the values in this set contain numbers that have different decimal places. Hopefully, you start by wondering how many decimal places should we round off the final answer. Again, this is open to interpretations. Therefore, I suggest that you ask your teacher for further clarification.
NOTE: For this problem though, I decided to round it off based on the number with the largest decimal places. I see that entry 0.254 contains three digits after the decimal point which is the biggest among others. So accordingly, I will keep in mind to round off the final answer for the mean with three digits after the decimal point.
- Determining the mean:
- Determining the median:
Similar to example 5, this set has an even count of entries. Expect to average the middle two values to solve for the median. Remember to round off your answer to the nearest three decimal places just like when we solved for the mean.
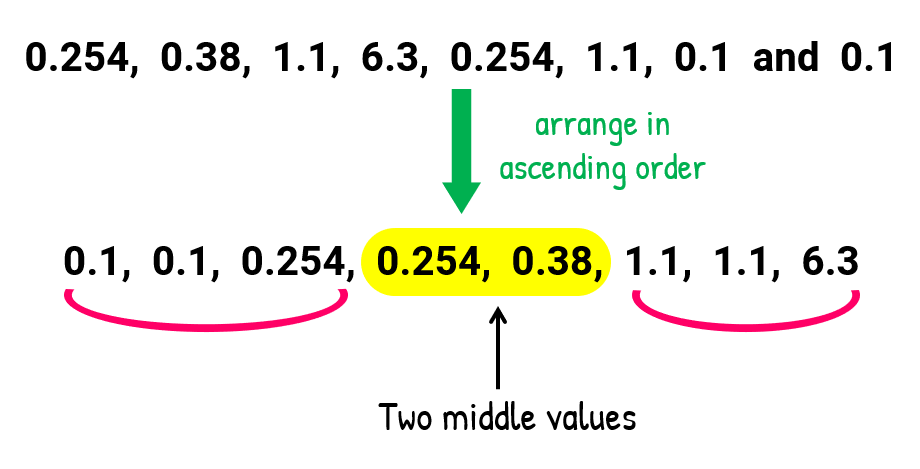
Here is the calculation for the median…
- Determining the mode:
We have three modes (trimodal) in this set which are 0.1, 0.254, and 1.1. They all repeat twice on the list!
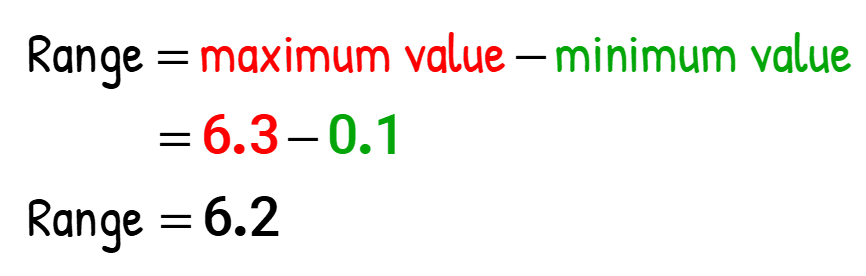
- Determining the range:
The maximum value in the list is 6.3, while the minimum value is 0.1. Therefore the range is computed as follows…
Example 7: Leroy wants to achieve an overall grade of B on his quizzes. Currently, he has the following scores from his previous eleven quizzes: 75, 83, 96, 86, 69, 74, 83, 86, 90, 60, and 80. What should be his next score in order to get a quiz average of 80?
Let “[latex]x[/latex]” be the unknown test score that Leroy needs to get. In order to set up the correct average, we need to make an adjustment on the number of entries being added: that is, from 11 to 12.
The working equation that can solve for the missing value of “[latex]x[/latex]” is the following…
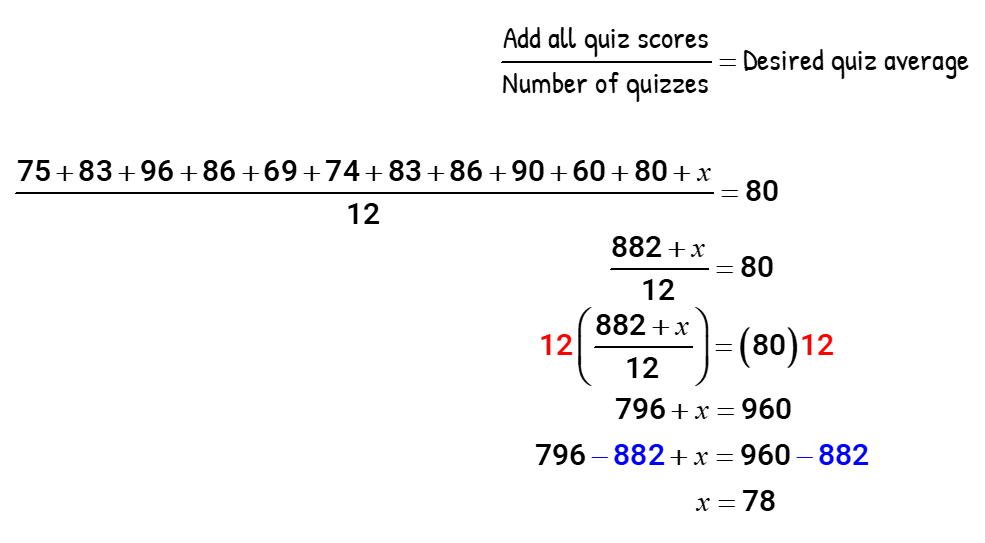
Leroy needs to score 78% on his next quiz in order to get a quiz average of 80%.
Example 8: Lisa is aware that she needs to take five major exams in the semester. Unfortunately, due to medical reasons, she is only able to take two exams with scores of 85 and 89. To accommodate her, the professor gives her a make-up exam that would count as three test grades. What score does she need to get on this make-up exam to garner a 90% average in all exams?
Solution:
Assign a variable to the unknown score. Let’s call it “[latex]y[/latex]”. The total number of exams is 5 because of her existing two exam scores which is added to the make-up exam that is counted as three. The desired equation to solve for the required score is…
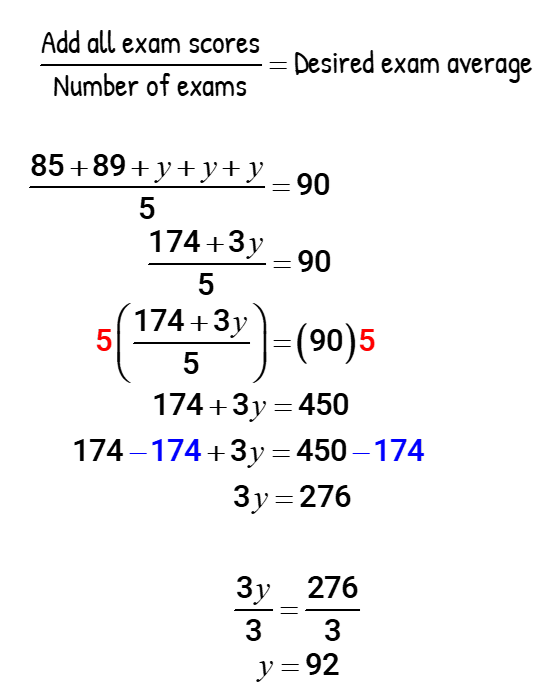
Lisa needs to score 92% on this single exam that’s counted as three test grades to achieve an overall exam of 90%.