
Graphing a Line using the x and y-Intercepts
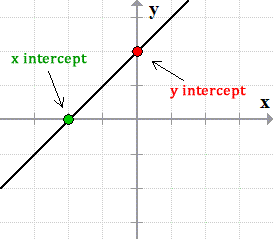
Another method to graph a line in the [latex]XY[/latex]-plane is to use the intercepts. What are intercepts? These are points of the line that are found on the [latex]\color{red}\large{x}[/latex] and [latex]\color{red}\large{y}[/latex] axes. There are two kinds of intercepts.
- The first one is called the x-intercept because it is the point of the line located on the horizontal axis ([latex]x[/latex]-axis).
- The second is the y-intercept which is the point of the line located on the vertical axis ([latex]y[/latex]-axis).
Here is a quick diagram that gives you the idea.
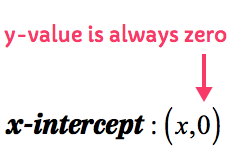
Since the [latex]x[/latex]-intercept is a point where the line crosses the [latex]x[/latex]-axis, it is a point with a [latex]y[/latex]-value of zero.
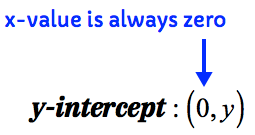
In the same manner, since the [latex]y[/latex]-intercept is a point where the line crosses the [latex]y[/latex]-axis, it must be a point with an [latex]x[/latex]-value of zero.
Using the informal definitions of [latex]x[/latex] and [latex]y[/latex]-intercepts above, it makes a lot of sense why the procedures below on how to find them work!
Rules on How to Find the Intercepts
- To find the x-intercept:
Let [latex]y = 0[/latex] in the equation, then solve for [latex]x[/latex].
- To find the y-intercept:
Let [latex]x = 0[/latex] in the equation, then solve for [latex]y[/latex].
Examples of How to Graph a Line using the x and y-intercepts
Example 1: Graph the equation of the line [latex]2x-4y=8[/latex] using its intercepts.
I hope you recognize that this is an equation of a line in Standard Form where both the [latex]x[/latex] and [latex]y[/latex] variables are found on one side of the equation opposite the constant term. It is a common practice in an algebra class to ask students to graph the line using the intercept method when the line is in Standard Form.
Here we go!
- To find the x-intercept:
Let [latex]y=0[/latex] in the equation, then solve for [latex]x[/latex].
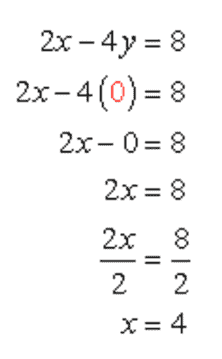
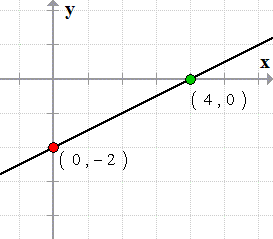
The [latex]x[/latex]-intercept is (4, 0).
- To find the y-intercept:
Let [latex]x=0[/latex] in the equation, then solve for [latex]y[/latex].
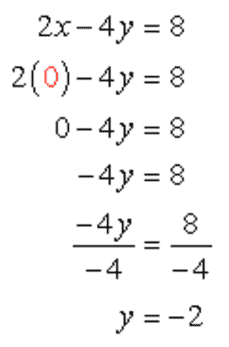
The y-intercept is (0, –2).
Now we can plot the two points on the [latex]xy[/latex] axis and connect them using a straight edge ruler to show the graph of the line.
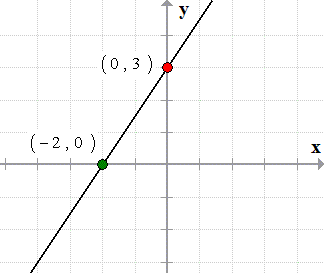
Example 2: Graph the equation of the line using its intercepts.
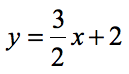
This equation of the line is in the Slope-Intercept Form. We can actually graph this using another technique which uses the slope and the [latex]y[/latex]-intercept taken directly from the equation. You can see a separate lesson on how to graph a line using slope and y-intercept.
Since this lesson is about intercepts, let’s work this out using this method.
- To find the x-intercept:
Let [latex]y=0[/latex] in the equation, then solve for [latex]x[/latex].
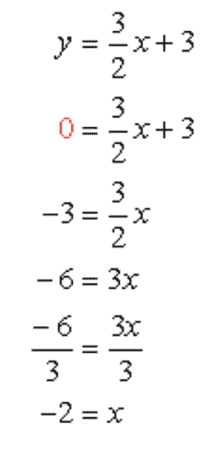
The [latex]x[/latex]-intercept is (–2, 0).
- To find the y-intercept:
Let [latex]x=0[/latex] in the equation, then solve for [latex]y[/latex].
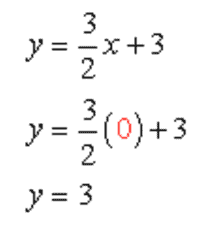
The [latex]y[/latex]-intercept is (0, 3).
Plot the intercepts in the axes and draw a straight line passing through them using a ruler.
You may also be interested in these related math lessons or tutorials:
Three Ways to Graph a Line
Graphing a Line using Slope and y-intercept
Graphing a Line using Table of Values