
Graphing a Line Using Table of Values
The most fundamental strategy to graph a line is the use of table of values. The goal is to pick any values of [latex]x[/latex] and substitute these values in the given equation to get the corresponding [latex]y[/latex] values. There’s no right or wrong way of picking these values of [latex]x[/latex]. As you develop your skills, you will learn how to select the appropriate values of [latex]x[/latex] depending on how you want to show the graph.
How to Set up a Table of Values
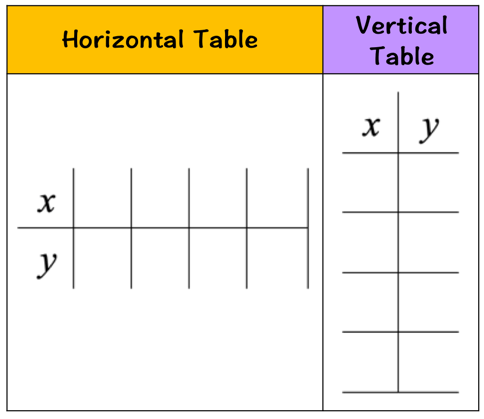
So how does it look? There are two ways to set up the table of values. If the table is presented horizontally, the top row will include all the values of [latex]x[/latex] while the bottom row will contain the corresponding [latex]y[/latex] value for each [latex]x[/latex]. On the other hand, when the table is shown vertically, the left column has the [latex]x[/latex]-values and the right column has the [latex]y[/latex]-values.
Examples of How to Graph a Line using Table of Values
Let’s take a look at some examples to see how it works.
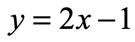
Example 1: Graph the equation of the line below using table of values.
It doesn’t matter which kind of the table of values to use. For this one, we will use the horizontal format. The next step is to pick values of [latex]x[/latex].
There is no wrong way of selecting the [latex]x[/latex] values. Keep in mind that we need a minimum of two points to graph a line. That means it’s okay to go above the minimum requirements for better accuracy. For me, I always plot three points or more. The reason is that if the line doesn’t pass through the three points, it tells me that I have committed an error in my calculation. This gives me the opportunity to recheck my work.
To decide what [latex]x[/latex]-values to choose, I suggest that you look at the size of our [latex]xy[/latex]-axis. More particularly look at available numbers in the horizontal axis.
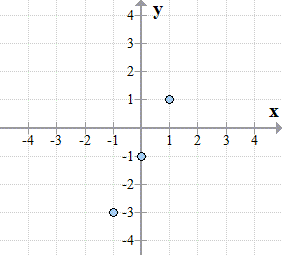
Suppose your teacher gives you this [latex]xy[/latex]-axis in your worksheet.
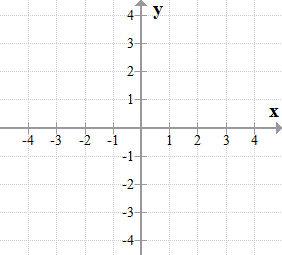
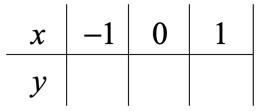
If we want the graph to show within this [latex]xy[/latex]-axis, it makes sense to pick [latex]x[/latex] values that are between [latex]{ – 4}[/latex] and [latex]{ + 4}[/latex]. Always try to include the zero in one of your [latex]x[/latex] values because this will simplify your calculation. So, we chose the following [latex]x[/latex]-coordinates then place them in the table accordingly.
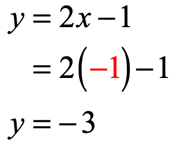
The next obvious step is to figure out the value of [latex]y[/latex] for each [latex]x[/latex] in the table. To do that, we will use the given equation of the line because it is the formula that gives us direct information how to arrive for the value of [latex]y[/latex] when given an [latex]x[/latex] value. We are going to use the formula three times since we have three values of [latex]x[/latex].
- [latex]x = – 1[/latex]
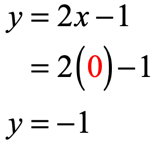
- [latex]x = 0[/latex]
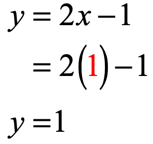
- [latex]x = 1[/latex]
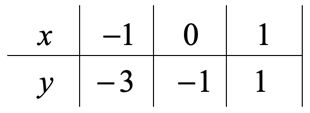
Let’s collect those output values and place them in the row where [latex]y[/latex] values are located.
Plot the three points in the [latex]xy[/latex]-axis.
Using a straight edge (ruler), connect the dots to see the graph of the line. That’s it!
Example 2: Graph the equation of the line below using table of values.
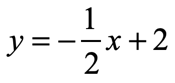
The first thing that stands out in this problem is that the coefficient of the “[latex]x[/latex]-term” is fractional. We need to be a little bit careful here since we can easily end up with fractional [latex]y[/latex]-values. Points with fractional coordinates can be tricky when plotting them on the axis.
For this problem, we want values of [latex]x[/latex] when multiplied by the coefficient of [latex] – {1 \over 2}[/latex] will give us positive or negative whole numbers. Since the denominator of the fraction is [latex]2[/latex], the values of [latex]x[/latex] must be multiples of [latex]2[/latex]. Right? Again, don’t forget to always include zero as one of your input values.
For this example, we will use the vertical format of the table values. For more practice, let’s have five input values of [latex]x[/latex].
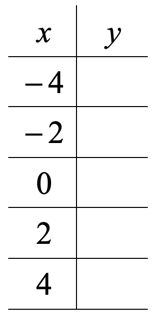
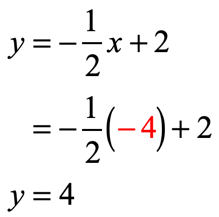
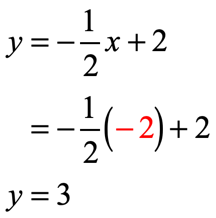
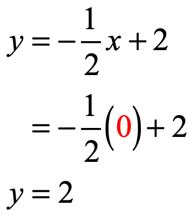
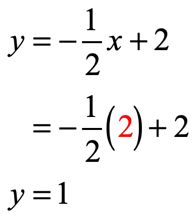
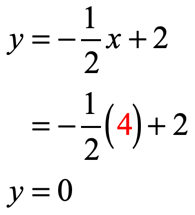
Solve for the value of [latex]y[/latex] for each [latex]x[/latex] using the equation.
- [latex]x = – 4[/latex]
- [latex]x = – 2[/latex]
- [latex]x = 0[/latex]
- [latex]x = 2[/latex]
- [latex]x = 4[/latex]
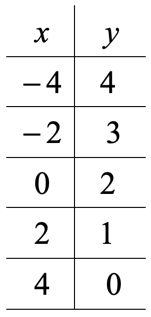
Collect all [latex]y[/latex]-values from our calculations and place them in the appropriate location in the table of values.
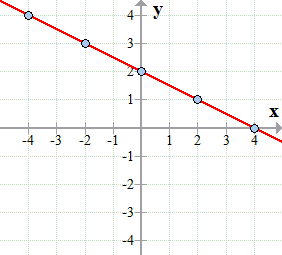
Now it’s time to plot each point in the coordinate axis and connect them to reveal the graph of the line. And we’re done!
Example 3: Graph the equation of the line below using table of values.
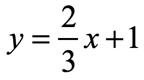
I see that we have a fractional coefficient of [latex]x[/latex] with a denominator of [latex]3[/latex]. That means our choice of [latex]x[/latex] coordinates will include zero ( as always! ) and some multiples of [latex]3[/latex].
Here are the selected values of [latex]x[/latex] for our table of values.
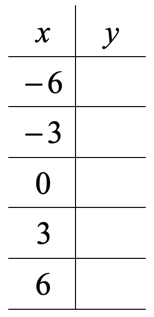
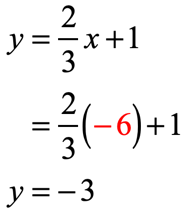
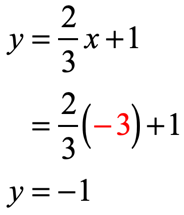
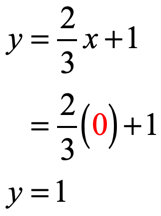
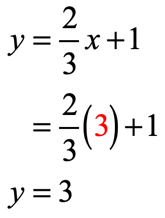
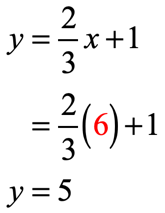
Let’s find the value of [latex]y[/latex] for each [latex]x[/latex] using the given equation [latex]y = {2 \over 3}x + 1[/latex].
- [latex]x = – 6[/latex]
- [latex]x = – 3[/latex]
- [latex]x = 0[/latex]
- [latex]x = 3[/latex]
- [latex]x = 6[/latex]
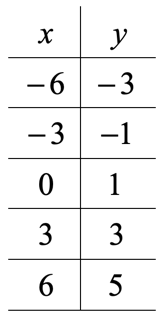
Put these [latex]y[/latex]-values together with the [latex]x[/latex]-values in a table.
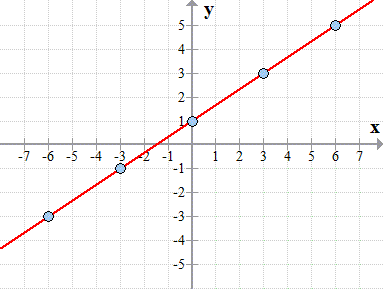
Plot the points in the Cartesian plane and connect the dots to show the graph of the line.
You may also be interested in these related math lessons or tutorials:
Three Ways to Graph a Line
Graphing a Line using Slope and y-intercept
Graphing a Line Using X and Y intercepts