
How to Graph Systems of Linear Inequalities
Previously, you learned how to graph a single linear inequality on the [latex]xy[/latex] plane. In this lesson, we will deal with a system of linear inequalities. The word “system” implies that we are going to graph two or more linear inequalities simultaneously. The solution to the system will be the area or region where the graphs of all linear inequalities in the system overlap.
NOTE: In order to be successful in graphing linear inequalities, you are expected to know how to graph a line on the xy-plane. Otherwise, take a moment to review the material.
Steps on How to Graph System of Linear Inequalities
Step 1: Graph every linear inequality in the system on the same xy axis. Remember the key steps when graphing a linear inequality:
- Isolate the [latex]y[/latex] variable to the left of the inequality.
- If the symbols are [latex] > [/latex] and [latex] \ge [/latex], we shade the area above the boundary line using dashed and solid lines, respectively.
- On the other hand, if the symbols are [latex]<[/latex] and [latex] \le [/latex], we shade the area below the boundary line using dashed and solid lines, respectively.
Step 2: Shade the region where all the areas of the linear inequalities intersect or overlap. If there is no region of intersection, we say that the system has no solution.
Let’s go over some examples to illustrate the procedure.
Examples of Graphing Systems of Linear Inequalities
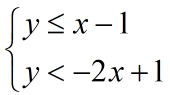
Example 1: Graph the following system of linear inequalities:
The good thing about the given problem is that all y-variables are already on the left side of the inequality symbol. In this form, we can easily determine what area to shade with reference to the boundary line.
- Graph the first inequality [latex]\color{red}y \le x – 1[/latex]. Since we have a “less than or equal to” symbol, the boundary line will be solid, and we will shade the area below the line.
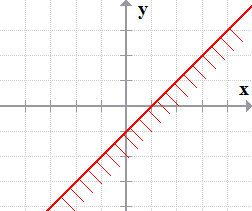
- Graph the second inequality [latex]\color{blue}y < – 2x + 1[/latex]. The symbol is just “less than” so the boundary line will be dashed or dotted, and we shade the area below it.
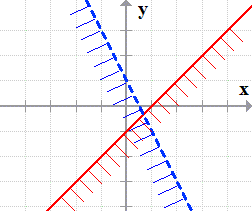
- The final solution to the system of linear inequalities will be the area where the two inequalities overlap, as shown on the right.
We call this solution area “unbounded” because the area is actually extending forever in a downward direction.
You will see an example of a “bounded” area in the next example.
Example 2: Graph the following system of linear inequalities:
The system contains three inequalities, which means we are going to graph three of them. Notice, that all of the inequality symbols have an “equal to” component. This tells us that all the boundary lines will be solid.
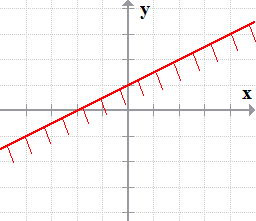
- Here is the graph of the first inequality where the boundary line is solid, and the shaded area is found below it.
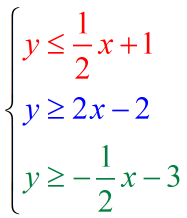
[latex]\color{red}\boxed{y \le {1 \over 2}x + 1}[/latex]
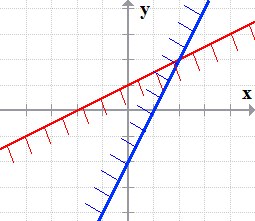
- The second inequality will have a solid boundary line, and the shaded area is found above it.
[latex]\color{blue}\boxed{y \ge 2x – 2}[/latex]
- Finally, the third inequality will also have a solid boundary line, and we shade the area above it.
[latex]\color{green}\boxed{y \ge – {1 \over 2}x – 3}[/latex]
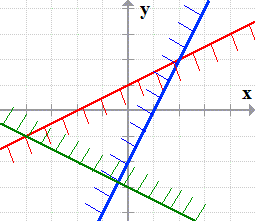
- As you can see, the shaded areas of the three linear inequalities overlap right in the middle section.
We call this system “bounded” because the region where all solutions lie are enclosed by the three sides coming from the boundary lines of the linear inequalities.
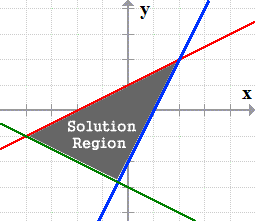
Example 3: Graph the following system of linear inequalities:
When I look at the three inequalities included in the system, there are three things that I need to consider:
- Rewrite the first inequality [latex]x + 2y < 2[/latex] such that the [latex]y[/latex] variable is alone on the left side. If you work this out correctly to isolate [latex]y[/latex], this inequality is equivalent to the equation [latex]y < – {1 \over 2}x + 1[/latex].
- The inequality [latex]y > – 1[/latex] will have a horizontal boundary line.
- The inequality [latex]x \ge – 3[/latex] will have a vertical boundary line.
If you need extra help, learn how to graph vertical and horizontal lines.
Now were are ready to graph each one of them.
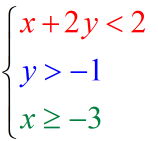
- The graph of the first inequality will be a dotted boundary line with shaded the area found under it.
[latex]\color{red}\boxed{y < – {1 \over 2}x + 1}[/latex]
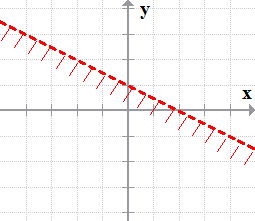
- The graph of the second inequality is a dashed horizontal line passing through the y-intercept at -1 with the shaded area above it.
[latex]\color{blue}\boxed{y > – 1}[/latex]
- The graph of the third inequality is a solid line passing through the x-intercept at -3 with the shaded area to its right.
[latex]\color{green}\boxed{x \ge – 3}[/latex]
- The solution to this system is the common area where all three inequalities intersect.
This is also a “bounded system” where the solution region is enclosed by two dashed line segments and one solid line segment.
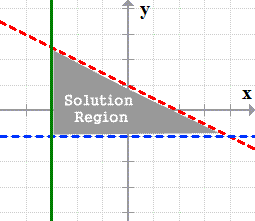
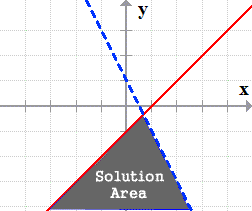
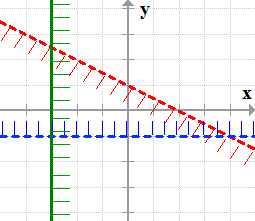
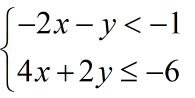
Example 4: Graph the following system of linear inequalities:
Both of the inequalities need some rewriting so that the variable “y” is located on the left side by itself.
Here’s the first one. Make sure to switch the direction of the inequality symbol whenever you divide the inequality by a negative number.

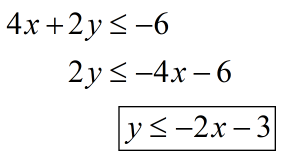
And here’s the rewriting of the second inequality. This time we don’t divide the inequality by a negative number; that’s why the orientation or direction of the inequality symbol remains the same.
Let’s go ahead and graph them.
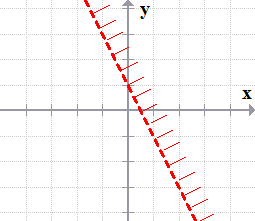
- The graph of [latex]{y > – 2x + 1}[/latex] is a dotted or “broken” line having the shaded area above it.
- The graph of [latex]{y \le – 2x – 3}[/latex] is a solid line with the shaded area under it.
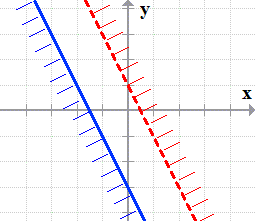
Since the two shaded areas don’t intersect or overlap, this tells us that the given system of inequalities has NO SOLUTION.
You may have also observed that the boundary lines have equal slopes, both m = –2, which implies that they are parallel lines and, therefore, won’t intersect.
You may also be interested in these related math lessons or tutorials:
Steps on How to Graph Linear Inequalities