How to Graph Vertical and Horizontal Lines
The equation of a vertical line comes in the form
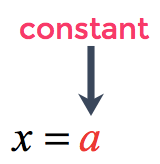
where [latex]a[/latex] is just a constant
Notice that this equation doesn’t contain any variable [latex]y[/latex]. The absence of [latex]y[/latex] means that it can take any values. Here’s an example.
An Example of Graphing a Vertical Line
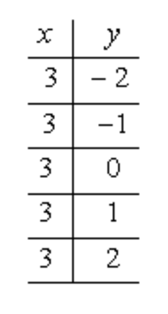
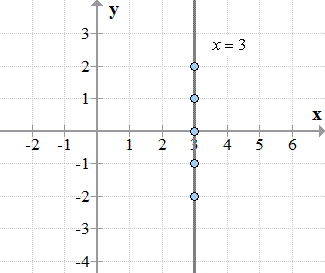
Graph the vertical line [latex]x = 3[/latex].
The equation doesn’t have the variable [latex]y[/latex] which implies that it could assume any numerical values for [latex]y[/latex]. In the table of values, you will see that “[latex]3[/latex]” is the repeating value in the column of [latex]x[/latex] while having different values in the column of [latex]y[/latex].
This is precisely the interpretation of the equation [latex]x = 3[/latex].
So, we can now plot the points on the [latex]xy[/latex]–axis to see how it looks. As you can see, it is a vertical line parallel to the [latex]y[/latex]-axis and passing through the point [latex]\left( {3,0} \right)[/latex].
On the other hand, the equation of a horizontal line comes in the form
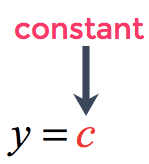
where [latex]c[/latex] is just a constant
This time around, the equation doesn’t have any variable [latex]x[/latex]. The absence of [latex]x[/latex] means that the variable [latex]x[/latex] can take any numerical values while the value of [latex]y[/latex] is being held constant. Here’s an example.
An Example of Graphing a Horizontal Line
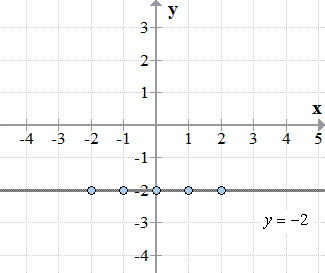
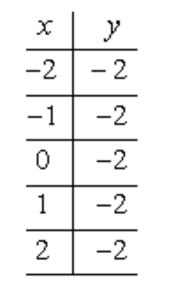
Graph the horizontal line [latex]y = – 2[/latex].
Since we have no [latex]x[/latex]-variable in the equation, it is okay to pair the [latex]y[/latex]-coordinate of [latex] – 2[/latex] with any [latex]x[/latex]-values. When you construct the table of values for this, the [latex]y[/latex]-coordinates will be the same throughout while the [latex]x[/latex]-coordinates can have different values.
Observe, the [latex]y[/latex]-column is populated with the same value of [latex] – 2[/latex].
Graphing these points in the [latex]xy[/latex]-axis, we have a horizontal line parallel to the [latex]x[/latex]-axis and passing through the point [latex]\left( {0, – 2} \right)[/latex].